Dashboard - Altimeter
- A remote display for the Altimeter
application, the Altimeter dashboard provides elevation or pressure information (35/35t) when and where you need it.
-
Touch the Altimeter dashboard to open the
Altimeter application.
-
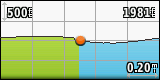
The green History Plot represents recorded information while the blue Future Plot represents the predicted journey ahead.
-
The orange sphere represents your present location.
-
Plot Types and Scales can be configured directly from the
Altimeter application or [Setup > Altimeter].
-
Accent colors are displayed using the day/night colors selected in [Setup
> Appearance].