
By default, the elevation plot displays the elevation for an elapsed time.
Read this GPSVisualizer tutorial on Calculating Elevation Gain, and refine your recorded elevation data as desired.
See How To... > Altimeter > Accuracy for important information regarding Garmin Outdoor products reported elevation value.
Use the Barometric Pressure plot to predict the
weather: See
How To... > Altimeter > Weather Station
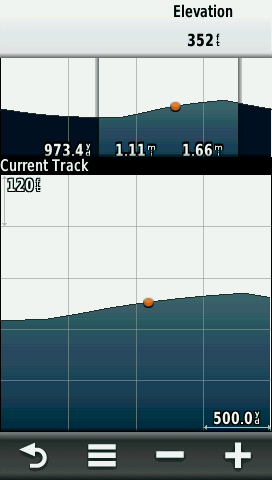
Select the X or Y axis scales and use + and - to adjust.
Select an individual point on the plot and details about the point will appear in the upper-left corner of the plot.
[Change Plot Type]
[Elevation/Time] [Elevation/Distance] [Barometric Pressure] [Ambient Pressure]
[Reset]
[Reset Trip Data] [Delete All Waypoints] [Clear Current Track] [Reset All Settings]
[Calibrate Altimeter]
Runs through a calibration sequence. Need to enter correct elevation or correct pressure.
[Lock Data Fields]
Prevents data field changes.
[Restore Defaults]
Clears all user settings.